This article is a part of Astral Web’s Comprehensive Guide to JIRA!
Previously: 09 Getting Started with JIRA: User Roles & Permissions
By now you may have gotten used to how JIRA Clouds looks and navigates, but here are some additional details about the interface that you may or may not already know.
Dashboards
Dashboards are the first page your users will land when they log into JIRA. The space is useful for filtering and sharing JIRA information, which is achieved by adding different types of gadgets such as search filters, pie charts, and other data collection formats.
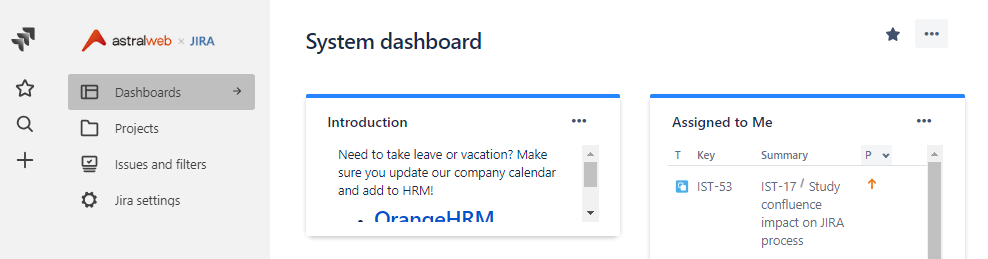
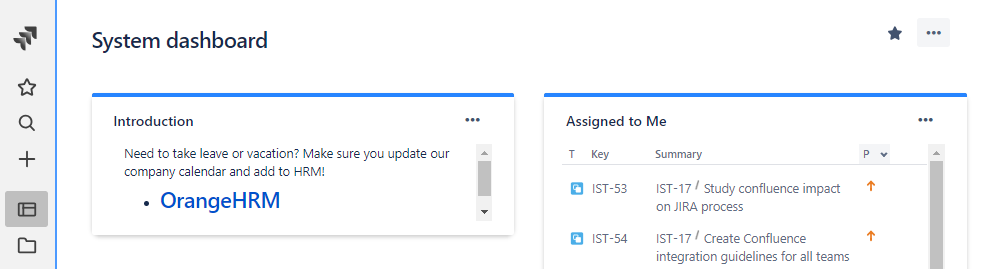
System Dashboard
The default dashboard you will get when you start JIRA is the System Dashboard. This default dashboard includes the “Introduction”, “Assigned to Me”, and “Activity Stream” gadgets. These are basic and fairly useful, but there are much more gadgets that JIRA provides for you to make user of. To do this, you will need to create new custom dashboards.
Custom Dashboards
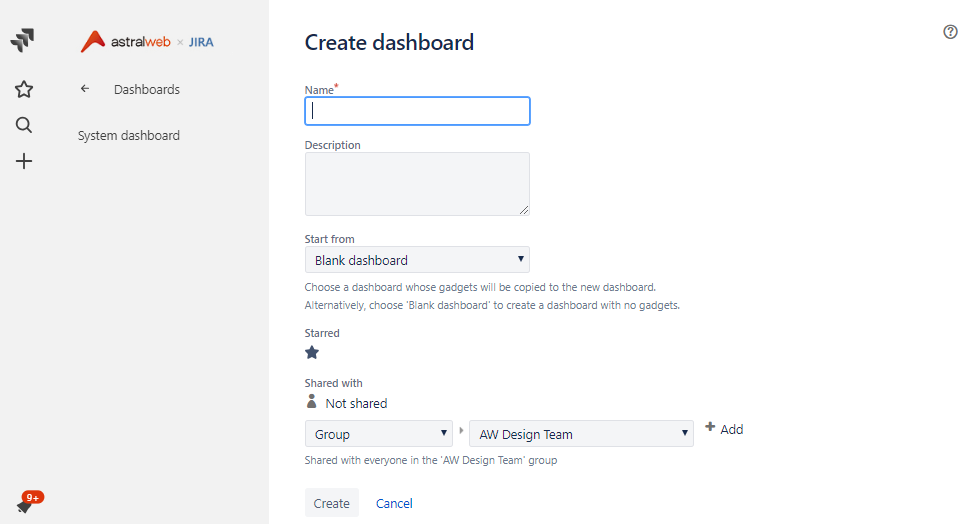
To add or modify more gadgets, you will need to create a new dashboard since you cannot make changes to the default dashboard. Select the top right “…” icon and select “Create Dashboard”. You must be an admin or user with permission to create new boards, and usually only the creator or user with higher permissions will be able to make changes.
Add a name (e.g. “Project Team ABC Dashboard” or “Design Team Dashboard”) that will be relevant to the users who will be using this dashboard.
We have created 3 basic levels of dashboards for our teams. Our highest level is a “Company Dashboard” that displays top level overall project information so we can quickly view the status of multiple projects at once. Only administrators can access this dashboard. We also have dashboards for each team by function such as “Design Team”, “Development Team”, and “Sales Team”. These filter projects and issues so they are most useful for each team and their members. We also have “Project Dashboards” for larger projects, so the project managers can get an overview of their entire project on the dashboard.
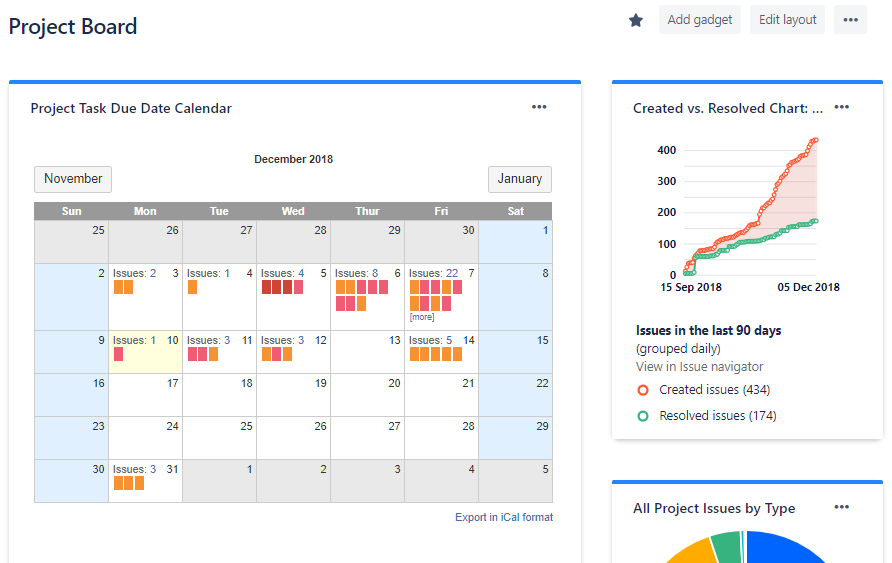
We use different dashboard gadgets to share information. For example, our Project Dashboard shows a calendar with hot issues, a line chart to show how many tickets have been created, and a pie chart to show the status of all of the tickets. This helps us understand the overall situation of one project.
Dashboard Gadgets
JIRA offers a few dozen dashboard gadgets to use. There are some 3rd party gadgets that can be purchased, but we have never tried any. Not many of the gadgets are amazing, but they do basic data collection and show different charts. The Calendar gadget and Pie Chart are some of the most useful ones. We recommend you to try all of them to see and feel if they are useful for you.
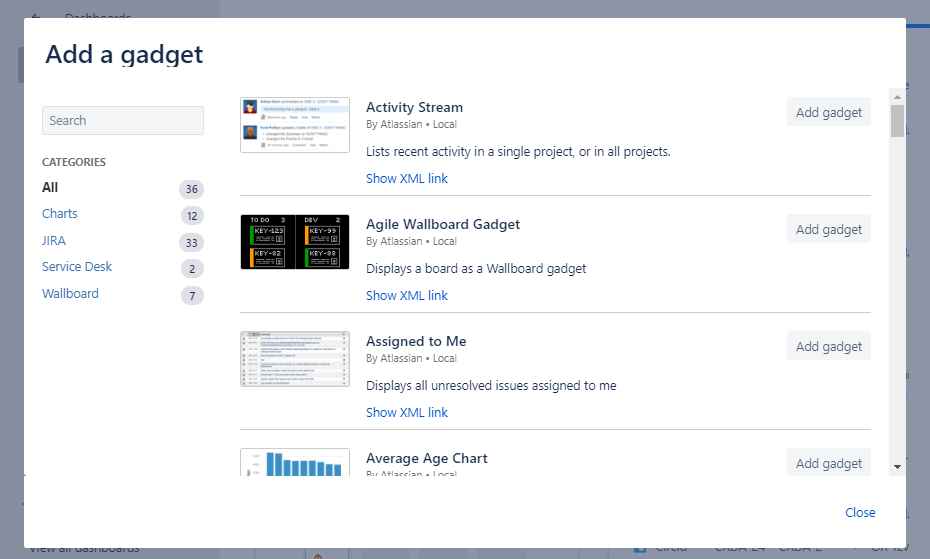
The most important factor is the data you are feeding to the gadget, which is all controlled by another feature called “Filters”. We will discuss how to use Filters in another article, but note that adding a gadget will not have enough power to filter fine details.
One type of gadget that is missing and we would love to have (which apparently used to be available in a much older version) is one that can add plain text or code. JIRA decided to remove these features. But, we do describe in our previous article that the “Introduction” section under your JIRA General System Settings is the only and best way to share custom text and basic code. Otherwise a 3rd party gadget may fulfill your needs.
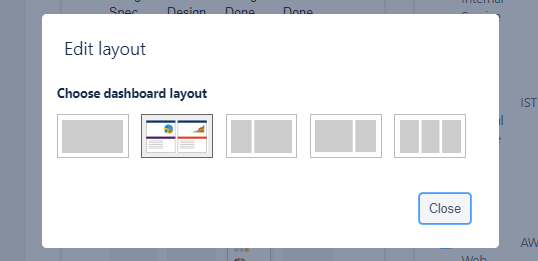
More Dashboard Space
Select the “Edit layout” button to change the dashboard layout. You will be able to select between basic 1-3 columns. We use the default 2-column layout since it’s a good balance. The 3-column layout gets too small to show detailed information. You can try switching between them to see which works best for you. Just be careful that your gadgets may jump around when you make changes.
You can also improve your viewing space by making the side menu smaller. Click the divider between the left menu and right side content to make the menu bar smaller. It isn’t much, but it does help to show more content on the right side if you have a small monitor. Otherwise you can zoom out on your browser (e.g. “ctrl” + ”-”) to see more.
Look and Feel
The overall usability of JIRA Cloud cannot be changed so much, but you can change the logo and colors of your interface. Go to the section under “JIRA Settings” > “System” > “Look and feel”.
We added a nice company logo (and JIRA since we had some extra space), which needs to be around 368px by 64px. There are also options to show Titles on browsers tabs, Colors, and Time Display.
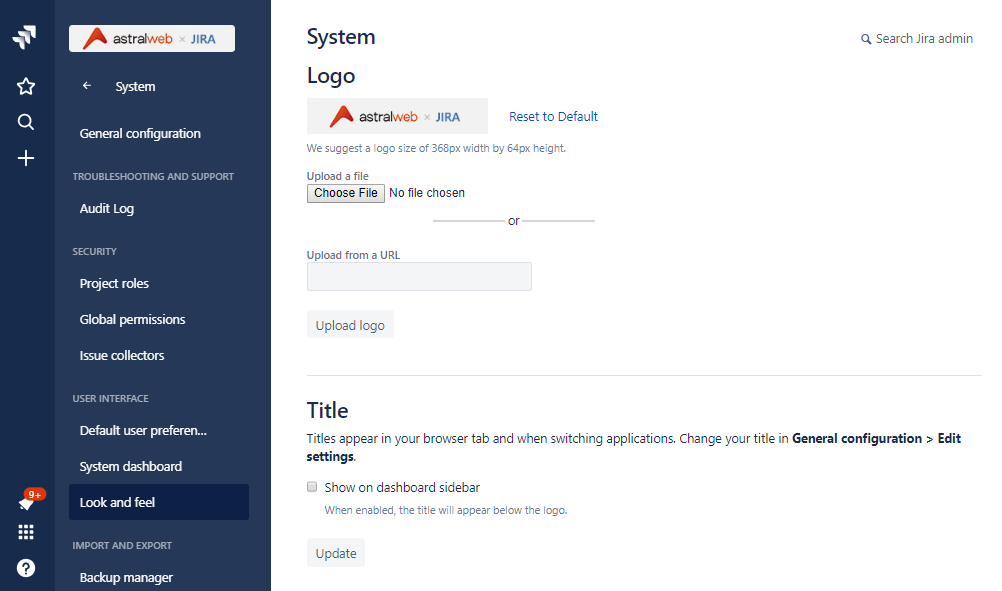
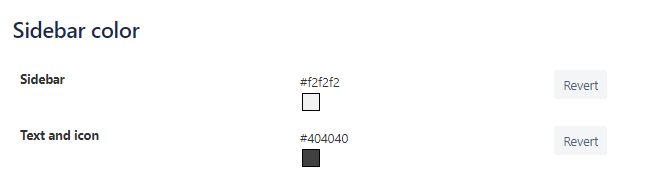
You can only choose two colors for interface. The background color of your sidebar, and the Text and Icon colors. It would be nice to have more control, but you can at least unify colors for easy reading or differentiate between multiple Atlassian web-apps, or just having the right color for your company.
JIRA Cloud, as most web-apps, is limited to modifying the interface, but we hope these tips help you improve usability for your team members.


Leave a Comment
You must be logged in to post a comment.