Benchmarking and performance analysis is a very common task when developing a web site, especially if the website is ment to sell services or products. A fast website will add a powerful value to customer experience in general; increasing also the chances of building loyalty and trust.
Magento provides two tools for helping with benchmarking a particular site: MAGE_PROFILER for code and database profiler.
MAGE_PROFILER
This profiling will display the processes and class resources involved with the specific url path being analyzed; listed as a dependency list at the bottom of the screen.

This profiling will allow developers to determine what classes or functions are taking too much time to execute, helping in filtering out the sections or coding that requires some improvement.
For enabling MAGE_PROFILER using type html it is required to execute the following commands:
bin/magento dev:profiler:enable html
bin/magento cache:flush
For disabling MAGE_PROFILER:
bin/magento dev:profiler:disable
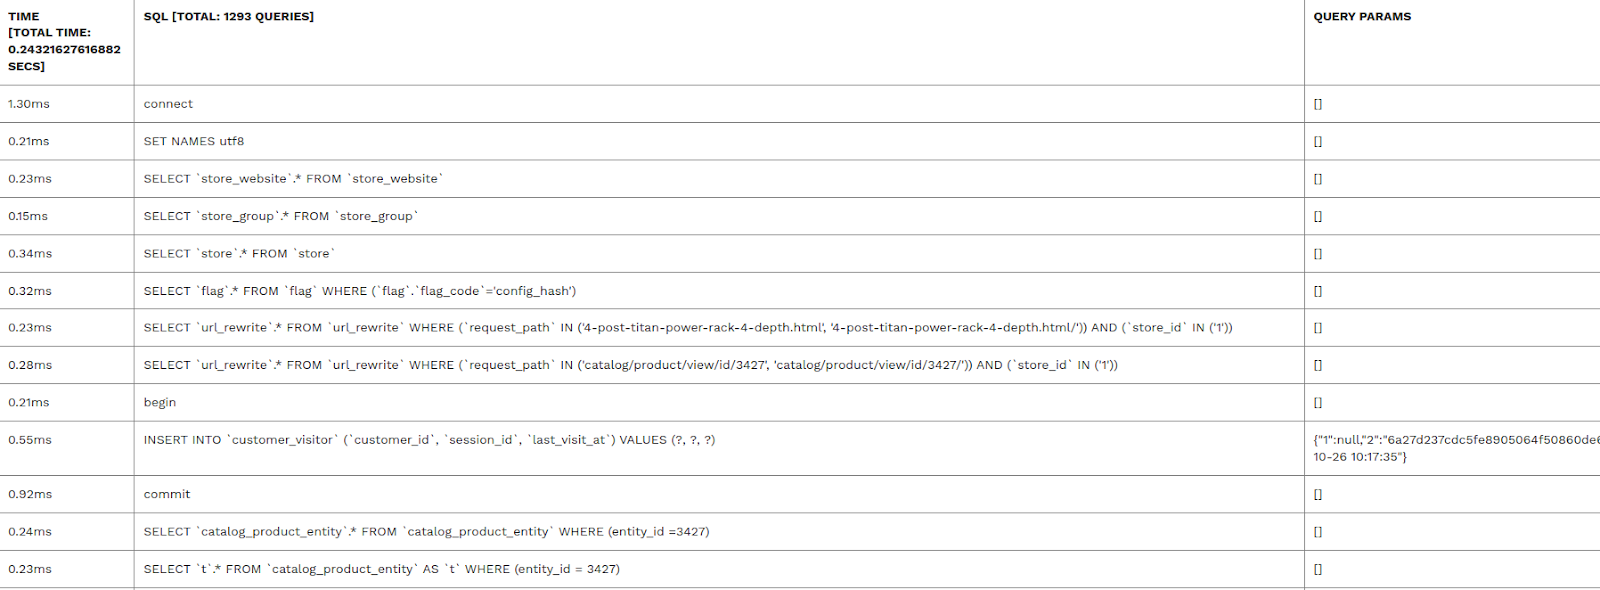
Database profiler
The database profiler is similar to the MAGE_PROFILER but is focused on database queries performance.
For enabling this profiling the following steps are required:
Step 1: Add a reference class to env.php
On <magento_root>/app/etc/env.php to add the following class reference:
‘db’ =>
…
‘default’ =>
array (
‘host’ => ‘localhost’,
‘dbname’ => ‘magento’,
‘…
‘active’ => ‘1’,
‘profiler’ => [
‘class’ => ‘\Magento\Framework\DB\Profiler’,
‘enabled’ => true,
],
),
),
),
Step 2 Modify the index.php file
On <magento_root>/index.php add the following after the $bootstrap->run($app); line in your bootstrap file:
/** @var \Magento\Framework\App\ResourceConnection $res */
$res = \Magento\Framework\App\ObjectManager::getInstance()->get(‘Magento\Framework\App\ResourceConnection’);
/** @var Magento\Framework\DB\Profiler $profiler */
$profiler = $res->getConnection(‘read’)->getProfiler();
echo “<table cellpadding=’0′ cellspacing=’0′ border=’1′>”;
echo “<tr>”;
echo “<th>Time <br/>[Total Time: “.$profiler->getTotalElapsedSecs().” secs]</th>”;
echo “<th>SQL [Total: “.$profiler->getTotalNumQueries().” queries]</th>”;
echo “<th>Query Params</th>”;
echo “</tr>”;
foreach ($profiler->getQueryProfiles() as $query) {
/** @var Zend_Db_Profiler_Query $query*/
echo ‘<tr>’;
echo ‘<td>’, number_format(1000 * $query->getElapsedSecs(), 2), ‘ms’, ‘</td>’;
echo ‘<td>’, $query->getQuery(), ‘</td>’;
echo ‘<td>’, json_encode($query->getQueryParams()), ‘</td>’;
echo ‘</tr>’;
}
echo “</table>”;
Step 3: Clean cache
bin/magento cache:flush
Finally, removing the database profiler is just as simple as rolling back the changes above.
There is no need to say that these profiling tools are beneficial for developers that want to understand a little more better the general user experience and to fix any hidden performance issue that is only noticeable at code or system level.